SAN FRANCISCO—While the VA performs well overall on key 30-day readmission rates, a study by researchers at the San Francisco VAMC questioned the utility of the measures for most of the health system’s hospitals.
The Centers for Medicare and Medicaid Services began publicly reporting the rate at which patients hospitalized for acute myocardial infarction, heart failure and pneumonia had a subsequent unplanned readmission for those conditions within 30 days of discharge on the Hospital Compare website in 2013. Data for VA hospitals is included on the site.
Since October 2012, CMS has penalized hospitals deemed to have excess readmissions compared to other hospitals by reducing their Medicare payments by up to 3%. In addition to the original three conditions, readmissions are now also tracked for chronic obstructive pulmonary disease, coronary artery bypass graft surgery and elective primary total hip arthroplasty and/or knee arthroplasty.
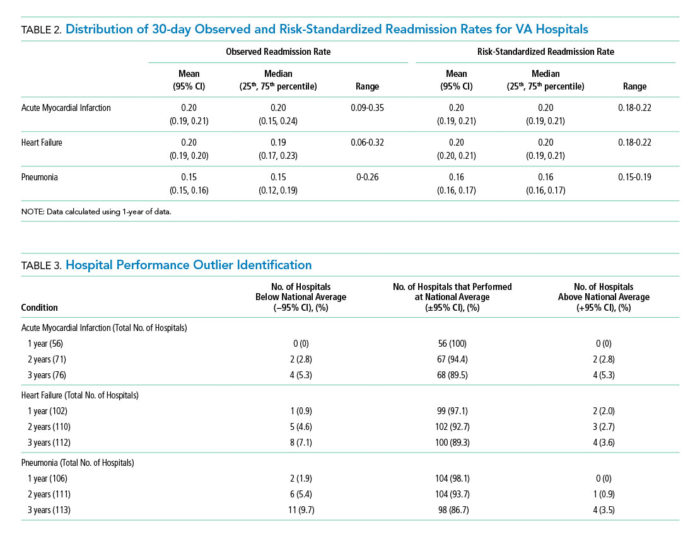
In a study published in the Journal of Hospital Medicine, Charlie M. Wray, DO, MS, of the San Francisco VAMC and the department of medicine at the University of California, San Francisco, and his colleagues found that only two VA hospitals—or 2% of those that qualified for reporting readmission rates in 2012—performed worse than the national average (exceeding the 95% confidence interval) for heart failure. That year, no VA hospitals were worse than the national average for pneumonia or AMI readmissions, and three beat the national average (less than the 95% confidence interval).1
Over a three-year period, four hospitals had readmission rates worse than the national average for all three conditions. During the same period, four were better than the national average for AMI, while eight and 11 VA hospitals outperformed the national average for heart failure and pneumonia, respectively.
CMS uses a three-year reporting period to calculate excess readmission rates and a single-year period to assess hospital quality and variations in facility performance.
To provide accurate comparison to the Medicare data, the analysis included only VA beneficiaries and Medicare fee-for-service patients who were age 65 or older and admitted to and discharged from a VA acute care center. Patients had to have been enrolled in Medicare for 12 months prior to and including the date of initial admission.
Volume Issue
Despite the overall strong performance by VA hospitals, the study identified several issues with using the CMS metrics to evaluate quality of care at the VA.
“We showed that if you apply these metrics to the VA, VA just doesn’t have the volume to pick up differences between institutions,” Wray told U.S. Medicine.
To be included in the CMS data and the VA study, hospitals had to have at least 25 AMI, heart failure and/or pneumonia admissions on an annual basis. As many VA hospitals treat a relatively small number of patients, only 38% to 77% of VA hospitals, depending on the condition and number of years included, met the reporting requirement.
“As the largest integrated healthcare system in the United States, the VA relies upon and makes large-scale programmatic decisions based on such performance data,” Wray and his colleagues wrote. “The inability to detect meaningful interhospital variation in a timely manner suggests that the CMS-derived 30-day [risk stratified readmission rates] may not be a sensitive metric to distinguish facility performance or drive quality improvement initiatives within the VA.”
Part of the problem lies with differences in the populations served by VA and other hospitals. “When metrics are derived in a certain population, (i.e., Medicare or Medicaid), with fewer comorbidities and older average age, they may not apply as well to other settings, such as the VA,” Wray said.
The volume problem extends beyond the VA, however. “The number of small community hospitals outweigh the large academic hospitals 10:1 in this country,” Wray noted, which means the metrics do not capture the performance of most U.S. hospitals.
For hospitals that meet the volume cutoff but do not have large numbers of patients in each category, the metrics likely still distort performance. “If an incident only occurs on an infrequent basis, are we making changes based on individual cases? Are changes in processes or care then driven by outliers?” Wray asked.
Other Options for Comparison
“Hypothetically, if you looked at hospitals on Hospital Compare in the San Francisco area, you might see a 4.8 in Palo Alto, 4.7 in Oakland and a 4.2 in Fresno. They may look different on a point basis, but they overlap in the confidence interval, so the information just isn’t that useful,” he noted.
“The problem is a one of human factor engineering; people don’t like ambiguity. If you were to fractionate the results into top, middle and lower performers, then that would probably give us a better sense of where we actually sit, because it is relative to others,” Wray added. “I don’t know what 4.2 means, but I do know what being better or worse than two-thirds of hospitals means.”
The VA’s internal benchmarking system, the Strategic Analytics for Improvement and Learning scorecard, consists of 25 quality metrics used to track quality and safety. SAIL scores are updated quarterly.
The study suggested that SAIL assessments may be too frequent to be particularly valuable, but that longer reporting time frames also create challenges.
“Using one year of data, the minimum required to utilize CMS models, showed that quarterly feedback (i.e., three months of data) may not be informative or useful given that few hospitals are able to differentiate themselves from the mean (±95% CI),” the authors wrote. “Although the capacity to distinguish between high and low performers does improve by combining hospital admissions over three years, this is not a reasonable timeline for institutions to wait for quality comparisons.”
SAIL does have some advantages, however. “We have the ability to compare within VA across multiple metrics and multiple facilities,” Wray said. “We still run into volume issues, but we get a better sense of overall performance, because we can it see across multiple metrics.”
Both assessments aim to accomplish the same goal, he noted. “We want a responsive healthcare system that, when given metrics and quality data, has the ability to respond and one in which we can isolate high performance and low performance and have them rewarded.”
But both have the similar issues. “The main point of our paper was to raise the flag on the current deficiencies in quality metrics in hospital medicine,” Wray said. “We would like to caution individuals against overreaction to some of these metrics and encourage those who are outliers or part of average to dig deeper into the metrics and identify how they could possibly improve based on those numbers.”
Wray CM, Vali M, Walter LC, Lopez L, Austin PC, Byers A, Keyhani S. Examining the Utility of 30-day Readmission Rates and Hospital Profiling in the Veterans Health Administration. J Hosp Med. 2019 Feb 20;14:E1-E6.