New Report Details Minority Veterans Demographics, Trends
Click to Enlarge
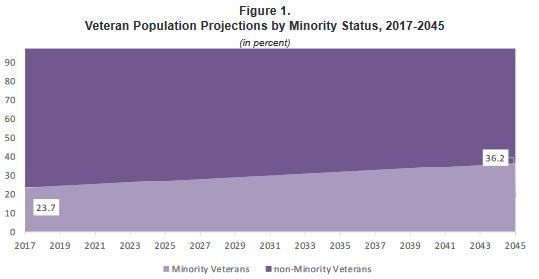
WASHINGTON — While members of minority groups made up almost a fourth of the total veteran population three years ago, more than a third of all living veterans are projected to be minorities over the next 25 years.
That’s according to a comprehensive report profiling the characteristics of minority veterans, based on a 2017 survey when 23.7% of veterans were minorities. That percentage is expected to rise to 36.2% over the next 25 years.1
The report from the National Center for Veterans Analysis and Statistics, which used data from a variety of surveys, also discussed how those veterans used VA benefits and services and what challenges they faced. “Over the past 30 years, racial and ethnic minorities have entered the military in ever-increasing numbers,” the authors wrote. “Ultimately, they will make the transition from servicemembers to veterans.”
In producing the report and better determining the demographics of minority veterans, the VA said it is seeking ways to better serve them.
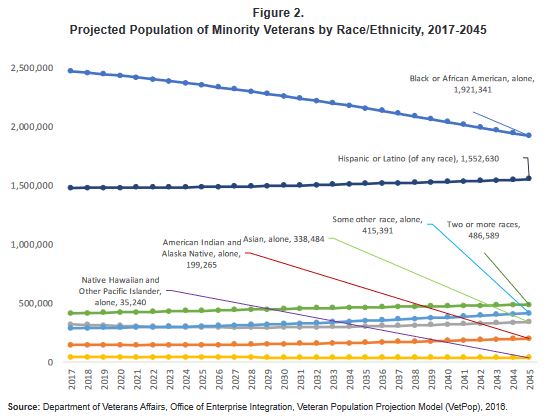
According to data from the 2016 Veterans Population Projection Model, more than 5.0 million veterans in the United States and Puerto Rico were minorities. Nearly half, 48%, served during the Gulf War Era (August 1990 to the present).
The report revealed that Black non-Hispanics had a disproportionately high representation in the minority veteran population, compared to the minority nonveteran population—49.9% and 31.1%, respectively. On the other hand, Hispanics were underrepresented, having a disproportionately low representation, 31.7% and 46.1%, respectively.”
Of minority veterans, 15.5% reported as being of Hispanic or Latino origin. About a quarter (26.1%) of National Guard and Reserve) forces identified themselves as being a racial minority and 11.5 as Hispanic in 2017.
One reason for the growing percentages is that active duty and reserve forces decreased by 8.4 and 12.4%, respectively, from 1995 to 2017, but minority personnel increased by 26.6% and 4.2%, respectively, during the same time period.
The median age of minority veterans was 56, compared with 39 for minority nonveterans, and those who had served had higher educational attainment than minority nonveterans. Minority veterans were:
- More likely to have completed a bachelor’s or advanced degree (24.4% versus 21.9%),
- More likely to have had some college as their highest level of education (42.1% versus 28.3%), and
- Less likely to have had a high school diploma or less as their highest level of education (33.5% versus 49.8%).
Still, the unemployment rate was higher for minority veterans aged 17 to 64, 4%, than nonminority veterans, 2.6%. The report also noted that a higher percentage of employed minority veterans worked in the government sector (32.7%) than minority nonveterans (12.2%).
Click to Enlarge
Possibly related to higher educational attainment, minority veterans overall were less likely than minority group members who had not served to live in poverty; about 9.9% of all minority veterans and 17.3% of all minority nonveterans had incomes below poverty levels. Veterans had higher household incomes, $59,966 in 2017, than nonveterans in the same group, $46,991.
An area showing a large gap was healthcare coverage, with only 4% of minority veterans doing without, compared to 16.17 of minority nonveterans, according to the report.
The VA pointed out that the percentage of minority veterans who used at least one of its benefit or services annually has shown steady growth from 38.0% in 2005 to 52.3% in 2017. The majority of minority veterans, 59%, were enrolled in the VHA healthcare system in 2017, with the number of minority veterans using VA health care having increased from 1.0 million (21.5%) to 1.7 million (34.6%).
The disability rate was high in those veterans, the authors pointed out, with 59% of minority veterans who used VHA healthcare having a service-connected disability rating. More than a fourth of 1.3 million minority veterans in 2017, 27.5%, received compensation from VA for a service-connected disability, and 61% had a combined disability rating of 50% or higher.
Tinnitus, limited flexion of the leg, lumbosacral or cervical strain, post-traumatic stress disorder and scares accounted for nearly 22.6% of all service-connected disabilities for minority veterans.
“The VA has made great strides in the past 30 years to meet the needs of minority veterans as one of the fastest growing sub-populations within the veteran community,” the authors wrote. “VA is committed to continue ensuring that minority veterans receive benefits and services equal to their non-minority counterparts and that they are treated with respect by all VA service providers. The challenge for the VA in serving the increasingly diverse population is to ensure that every veteran achieves the best outcomes regardless of who they are, where the live or what health problems they have.”
- Minority Veterans Report: Military Service History and VA Benefit Utilization Statistics. Data Governance and Analytics, Department of Veterans Affairs, Washington, DC. November 2020.